Setting the file. One moment.
Chapter 48 · Instrument LLM Analytics
Subchapter 48.36
references/traces.mdMarkdown6 KBView on GitHub
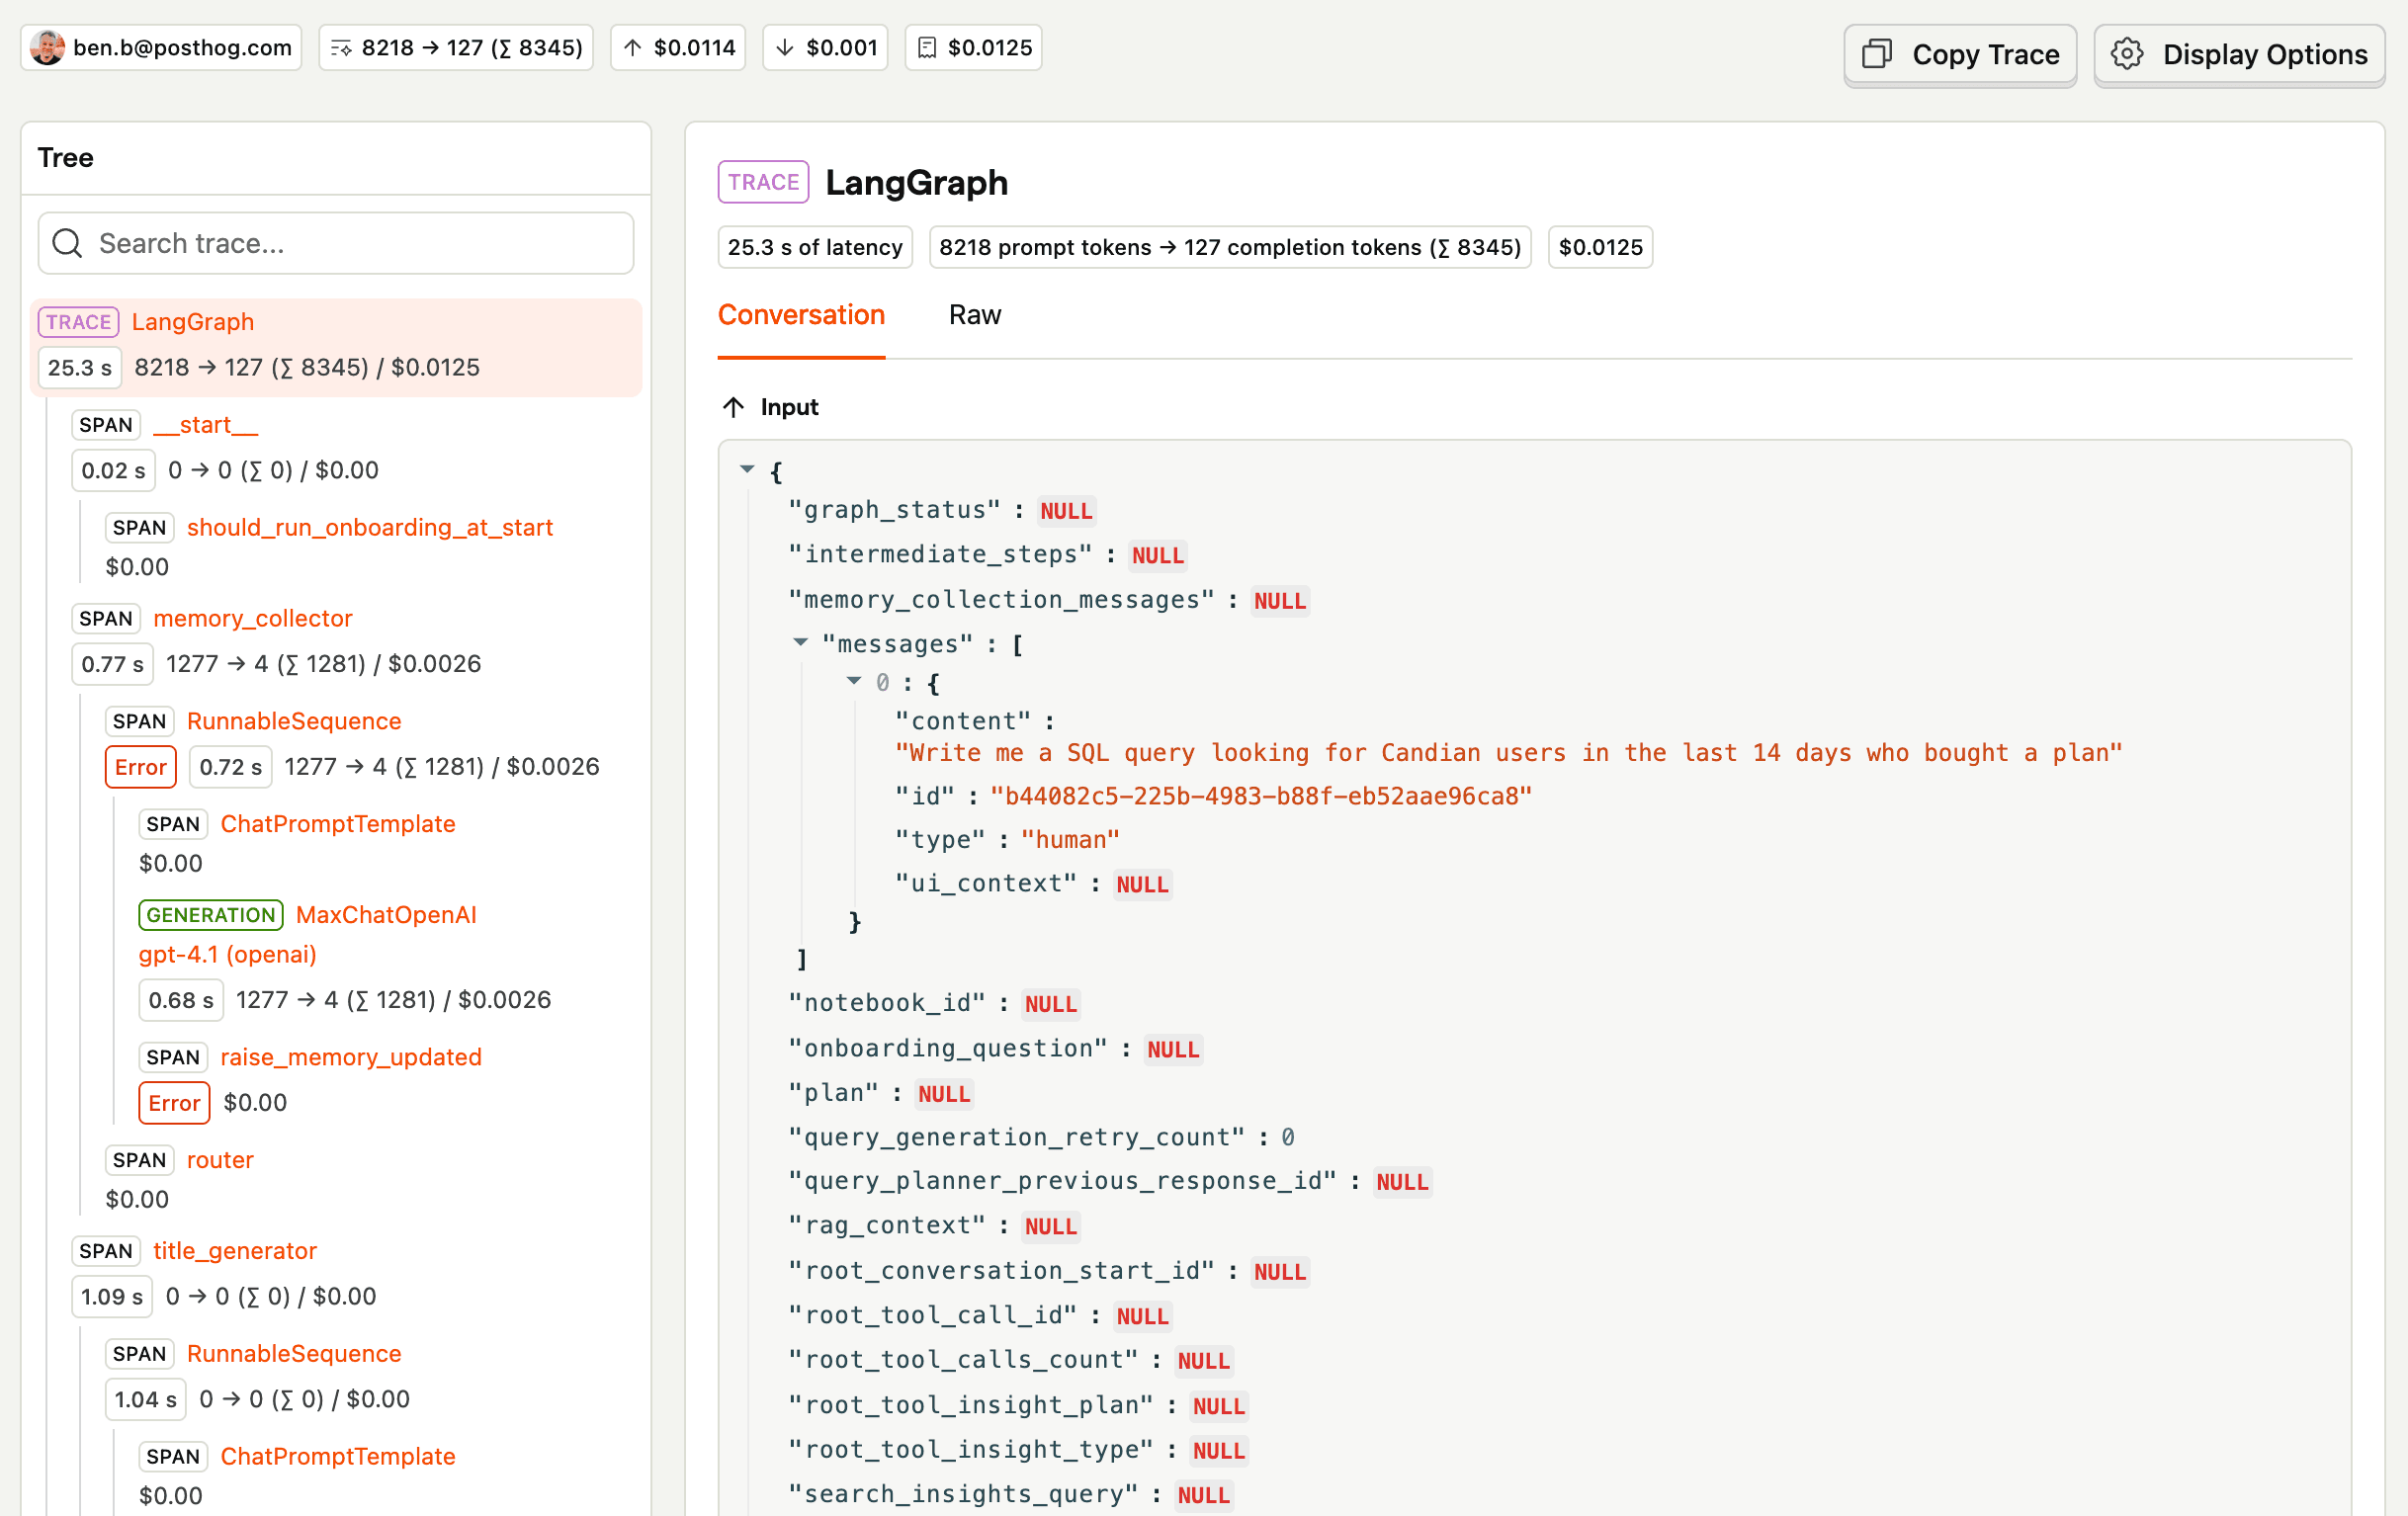
Traces are a collection of generations and that capture a full interaction between a user and an LLM. The lists them along with the properties autocaptured by PostHog like the person, total cost, total latency, and more.
$ai_trace_id): Groups related generations and spans together. Required for all AI Observability events.$ai_session_id): Optional property that groups multiple traces together based on your chosen grouping strategy.See the Sessions (opens in a new tab) documentation for more details on how to use $ai_session_id.
Clicking on a trace opens a timeline of the interaction with all the generation and span events. The trace timeline enables you to see the entire conversation, profiling details, and the individual generations and spans.
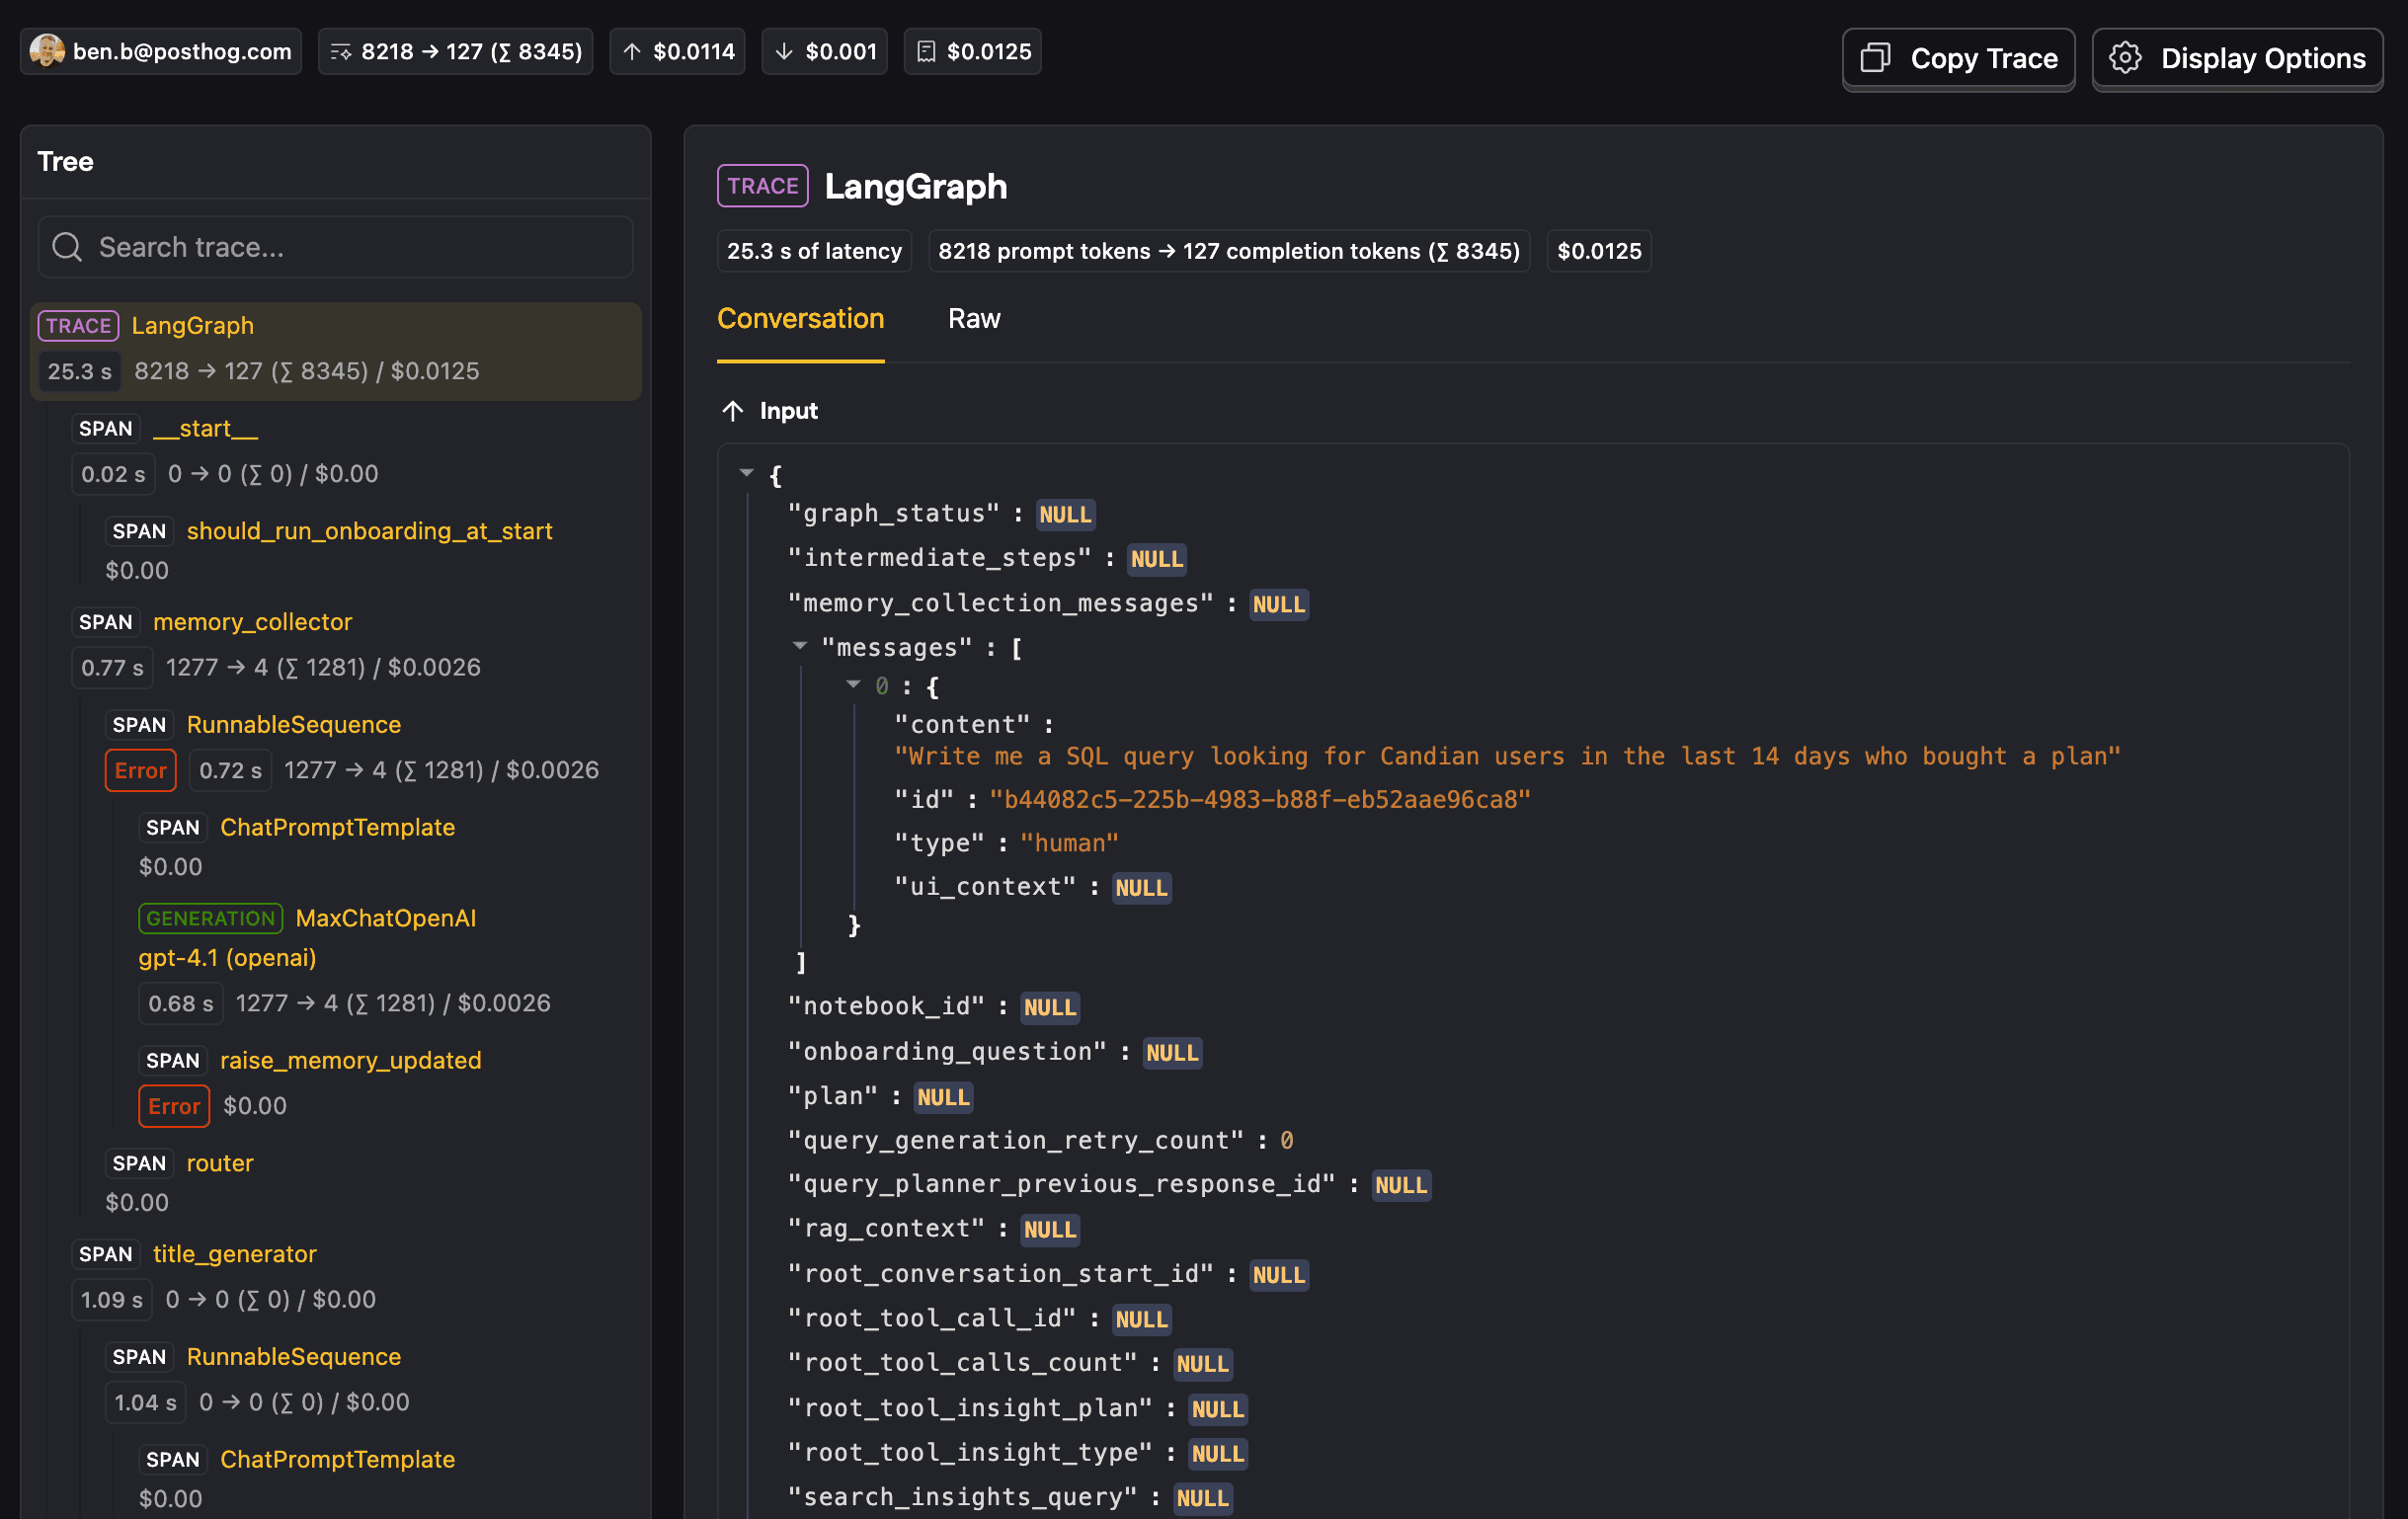
A trace presents LLM event data in a timeline, tree-structured view
When viewing a trace, you can control how conversation messages are displayed using the display options dropdown. The available options are:
Traces display any tools (opens in a new tab) called by the generations within them, shown as tags in the traces list. This makes it easy to see which conversations involved tool use at a glance.
PostHog can classify the sentiment of user messages in a trace as negative, neutral, or positive. Sentiment is computed on-demand using a local model when you view a trace — no data is sent to third-party services. Each trace gets an overall sentiment label and score, with a per-generation and per-message breakdown. See Sentiment classification (opens in a new tab) for more details.
PostHog AI (opens in a new tab) can search and analyze your LLM traces using natural language. When you’re on an AI Observability page (opens in a new tab), PostHog AI automatically switches to its AI Observability mode, giving it access to tools for searching traces by date range, model, cost, error status, and other properties.
Example prompts you can try:
PostHog AI returns trace details including name, latency, cost, token counts, and error count. It can also read individual traces to provide a detailed summary of what happened.
flowchart TD S[“$ai_session_id(optional)”] A[$ai_trace] A2[$ai_trace] B[$ai_generation] C@{ shape: processes, label: “$ai_spans“ } D[$ai_generation] E@{ shape: processes, label: “$ai_spans“ } F[$ai_generation] S -.-> A S -.-> A2 A --> B A --> C C --> D C --> E E --> F
Traces consist of the following event hierarchy:
$ai_session_id) can group multiple traces together.$ai_trace_id) is the top-level required grouping for LLM events.A trace is a group that contains multiple spans, generations, and embeddings. Traces can be manually sent as events or appear as pseudo-events automatically created from child events.
Event name: $ai_trace
| Property | Description |
|---|---|
| $ai_trace_id | The trace ID (a UUID to group related AI events together)Must contain only letters, numbers, and special characters: -, _, ~, ., @, (, ), !, ‘, :, |Example: d9222e05-8708-41b8-98ea-d4a21849e761 |
| $ai_session_id | (Optional) Groups related traces together. Use this to organize traces by whatever grouping makes sense for your application (user sessions, workflows, conversations, or other logical boundaries).Example: session-abc-123, conv-user-456 |
| $ai_latency | (Optional) The latency of the trace in seconds |
| $ai_span_name | (Optional) The name of the traceExample: chat_completion, rag_pipeline |
| $ai_is_error | (Optional) Boolean to indicate if the trace encountered an error |
| $ai_error | (Optional) The error message or object if the trace failed |
When you send generation ($ai_generation), span ($ai_span), or embedding ($ai_embedding) events with a $ai_trace_id, PostHog automatically creates a pseudo-trace event that appears in the dashboard as a parent grouping. These pseudo-traces:
$ai_trace eventThis means you can either:
$ai_trace events to control the trace metadataAsk a question
HelpfulCould be better