Chapter 48 · Instrument LLM Analytics
Subchapter 48.23
references/mirascope.mdMarkdown5 KBView on GitHub
Required
Full working examples
See the complete Python example (opens in a new tab) on GitHub. If you’re using the PostHog SDK wrapper instead of OpenTelemetry, see the Python wrapper example (opens in a new tab).
Install the OpenTelemetry SDK, the OpenAI instrumentation, and Mirascope.
pip install "mirascope[openai]" opentelemetry-sdk "posthog[otel]" opentelemetry-instrumentation-openai-v22
Required
Configure OpenTelemetry to auto-instrument OpenAI SDK calls and export traces to PostHog. PostHog converts gen_ai.* spans into $ai_generation events automatically.
from opentelemetry import trace
from opentelemetry.sdk.trace import TracerProvider
from opentelemetry.sdk.resources import Resource, SERVICE_NAME
from posthog.ai.otel import PostHogSpanProcessor
from opentelemetry.instrumentation.openai_v2 import OpenAIInstrumentor
resource = Resource(attributes={
SERVICE_NAME: "my-app",
"posthog.distinct_id": "user_123", # optional: identifies the user in PostHog
"foo": "bar", # custom properties are passed through
})
provider = TracerProvider(resource=resource)
provider.add_span_processor(
PostHogSpanProcessor(
api_key="<ph_project_token>",
host="https://us.i.posthog.com",
)
)
trace.set_tracer_provider(provider)
OpenAIInstrumentor().instrument()3
Required
Use Mirascope as normal. PostHog automatically captures an $ai_generation event for each LLM call made through the OpenAI SDK that Mirascope uses internally.
from mirascope.core import openai, prompt_template
@openai.call("gpt-4o-mini")
@prompt_template("Tell me a fun fact about {topic}")
def fun_fact(topic: str): ...
response = fun_fact("hedgehogs")
print(response.content)Note: If you want to capture LLM events anonymously, omit the
posthog.distinct_idresource attribute. See our docs on anonymous vs identified events (opens in a new tab) to learn more.
You can expect captured $ai_generation events to have the following properties:
| Property | Description |
|---|---|
| $ai_model | The specific model, like gpt-5-mini or claude-4-sonnet |
| $ai_latency | The latency of the LLM call in seconds |
| $ai_time_to_first_token | Time to first token in seconds (streaming only) |
| $ai_tools | Tools and functions available to the LLM |
| $ai_input | List of messages sent to the LLM |
| $ai_input_tokens | The number of tokens in the input (often found in response.usage) |
| $ai_output_choices | List of response choices from the LLM |
| $ai_output_tokens | The number of tokens in the output (often found in response.usage) |
| $ai_total_cost_usd | The total cost in USD (input + output) |
| […] (opens in a new tab) | See full list (opens in a new tab) of properties |
Recommended
Confirm LLM events are being sent to PostHog
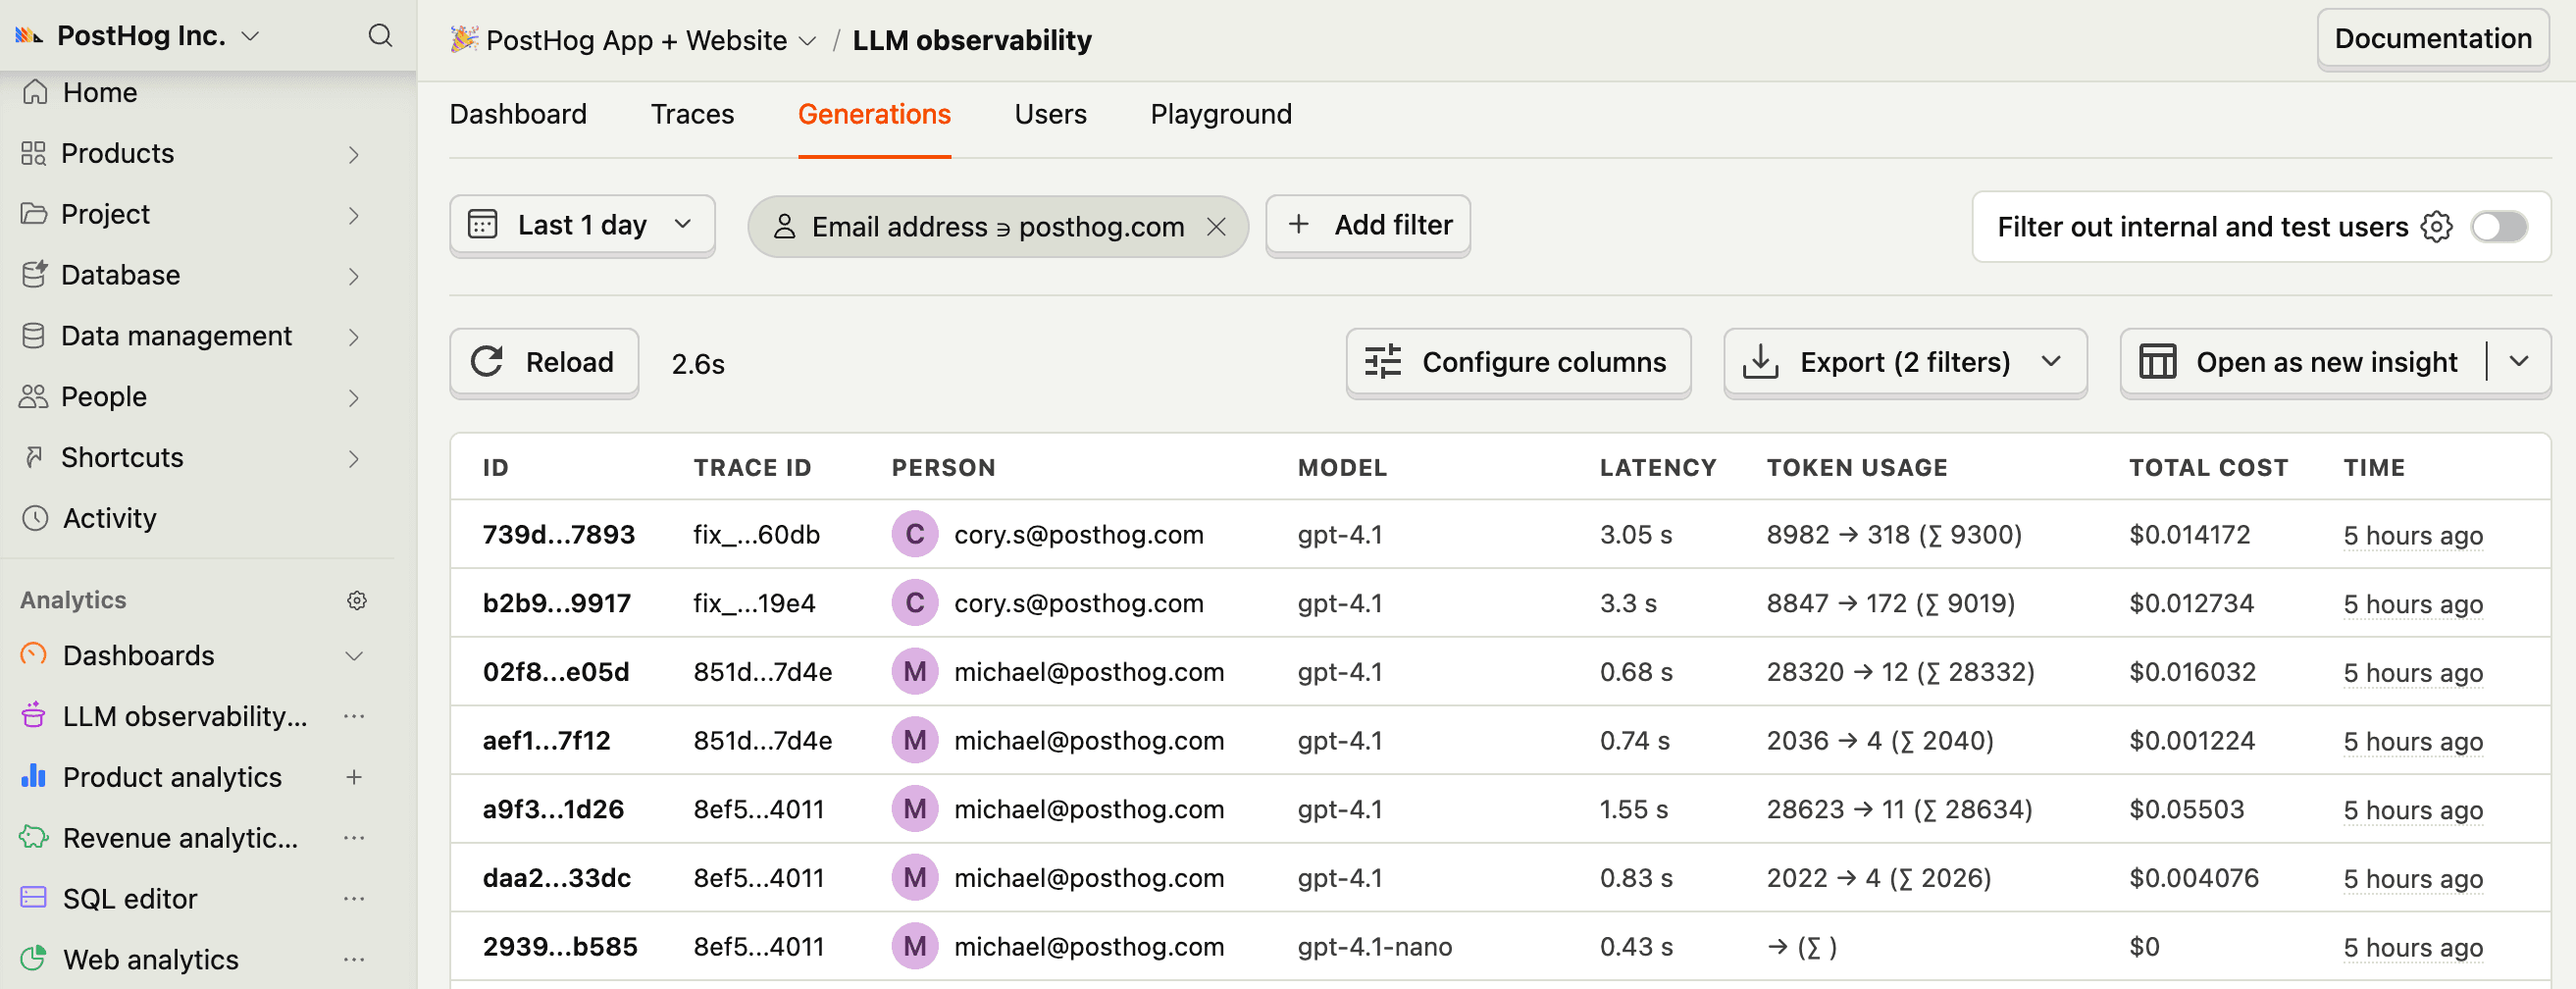
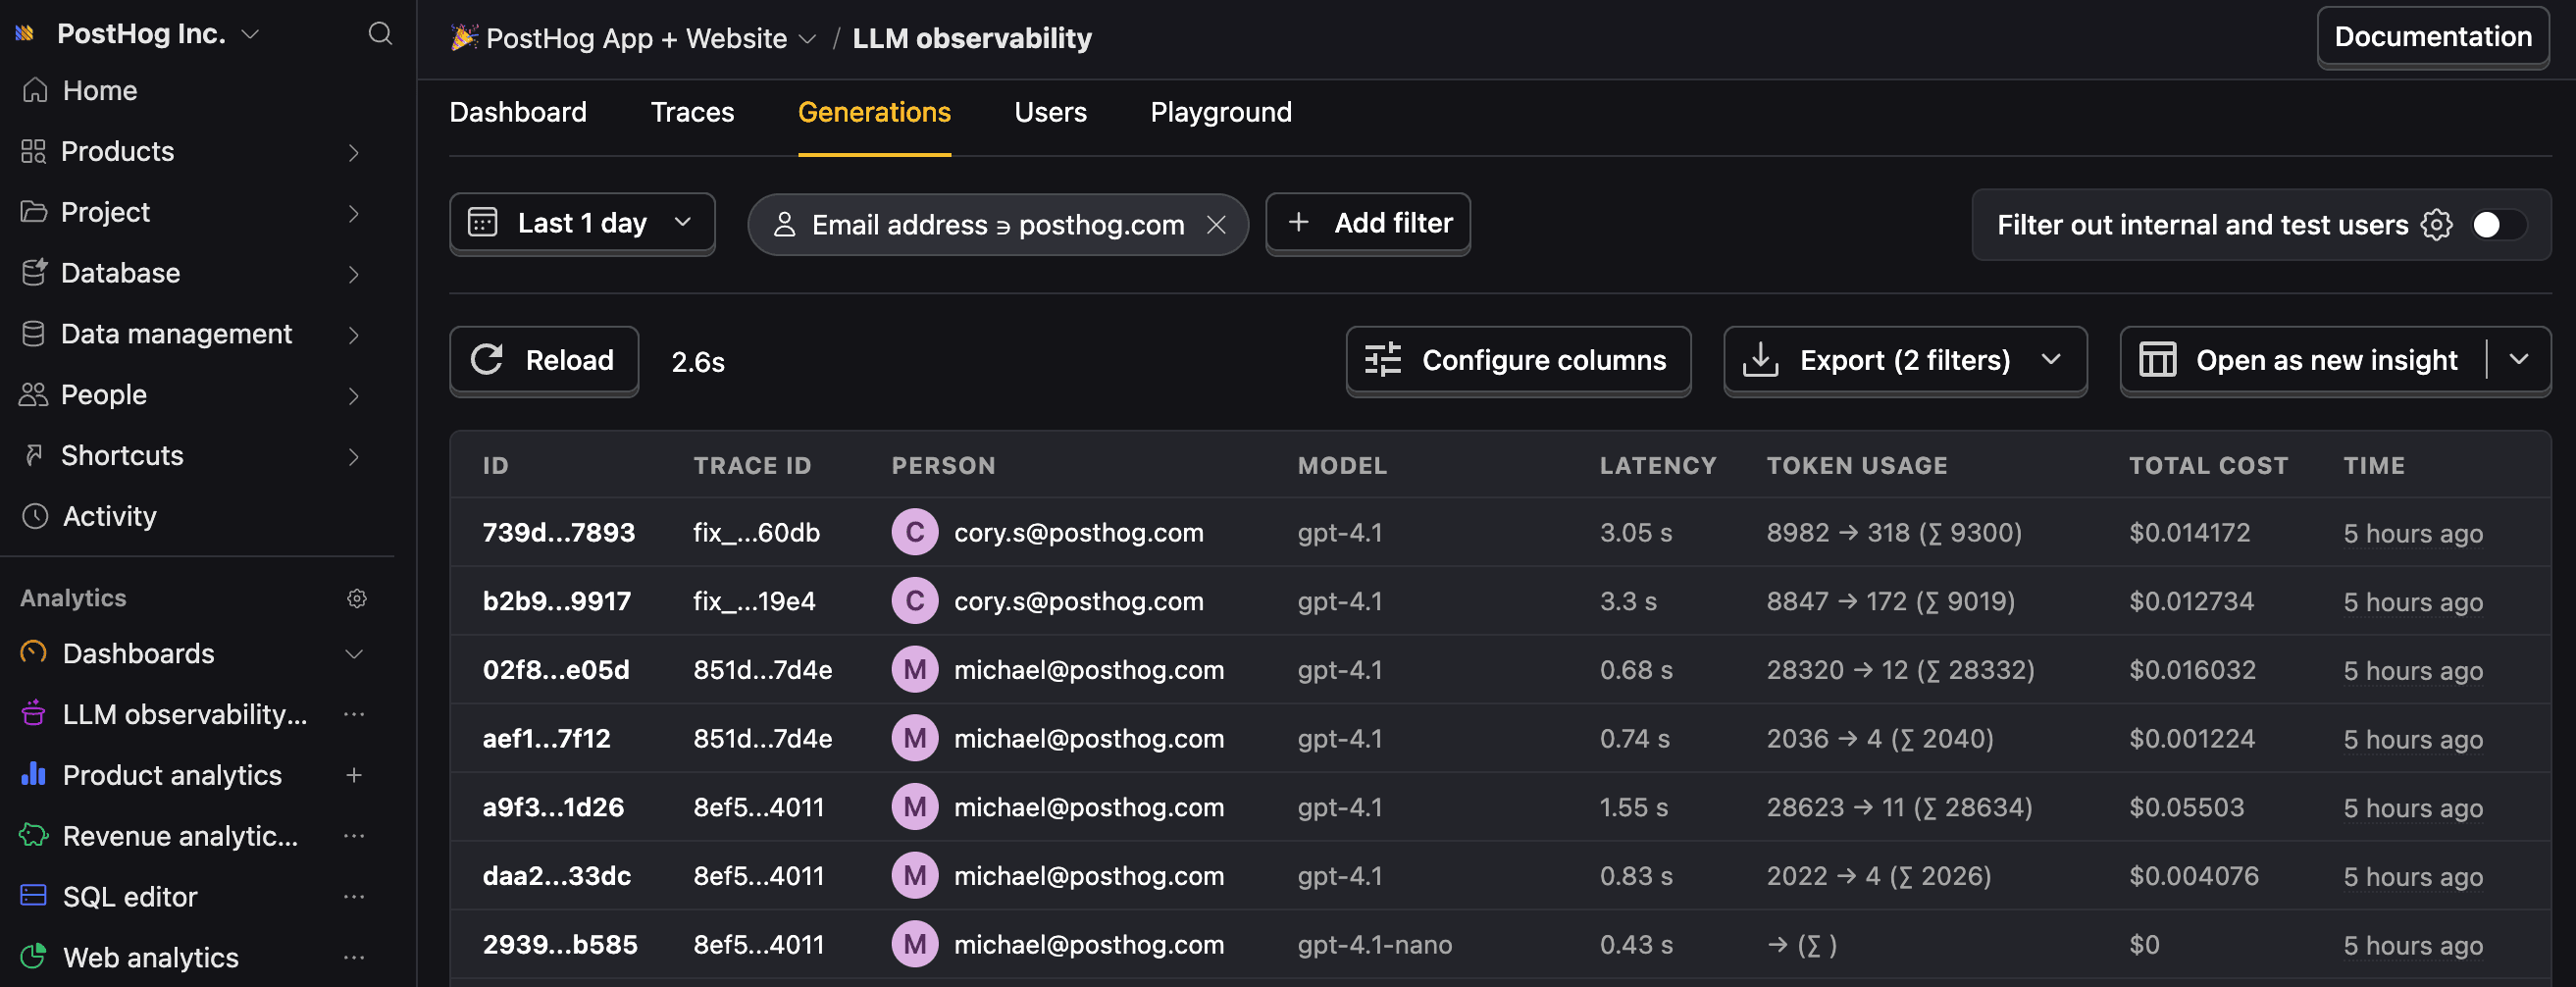
Let’s make sure LLM events are being captured and sent to PostHog. Under AI Observability, you should see rows of data appear in the Traces and Generations tabs.
4
Recommended
Now that you’re capturing AI conversations, continue with the resources below to learn what else AI Observability enables within the PostHog platform.
| Resource | Description |
|---|---|
| Basics (opens in a new tab) | Learn the basics of how LLM calls become events in PostHog. |
| Generations (opens in a new tab) | Read about the $ai_generation event and its properties. |
| Traces (opens in a new tab) | Explore the trace hierarchy and how to use it to debug LLM calls. |
| Spans (opens in a new tab) | Review spans and their role in representing individual operations. |
| Anaylze LLM performance (opens in a new tab) | Learn how to create dashboards to analyze LLM performance. |
Ask a question
HelpfulCould be better